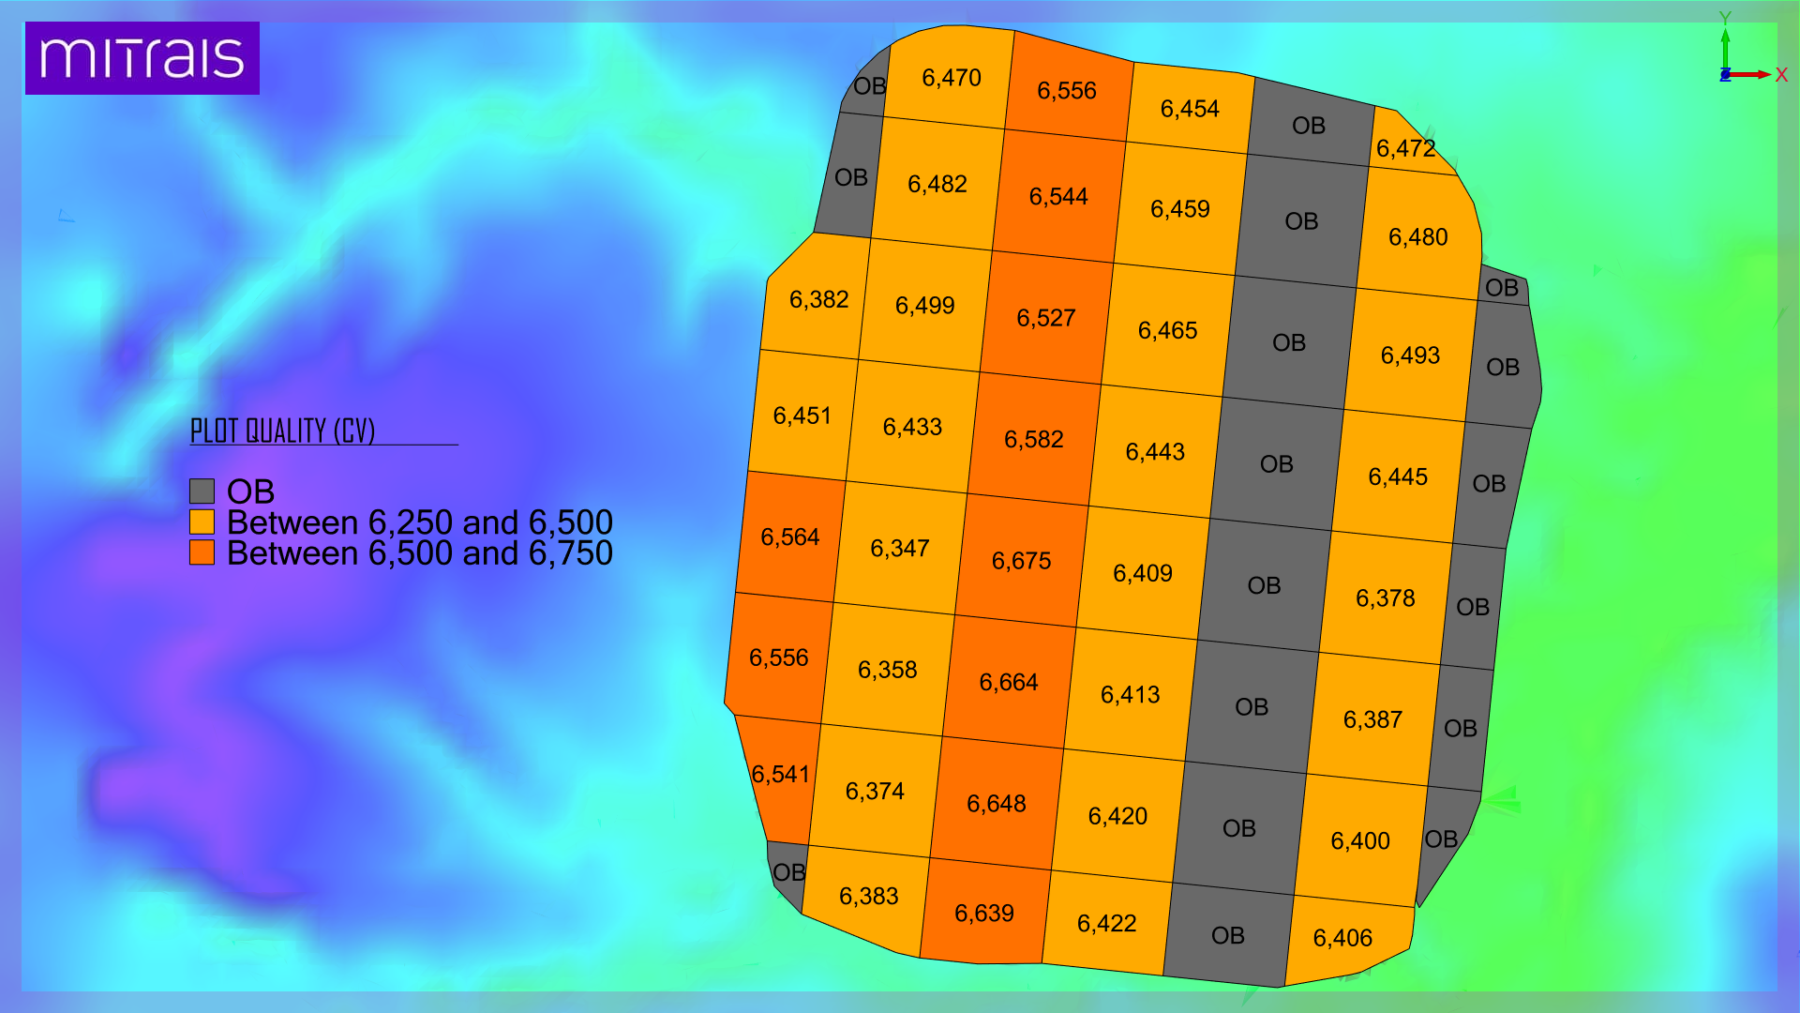
In this article, we will discuss how to show a map of the material quality distribution of a coal mining area based on its Calorie Value (CV).
Here are the steps:
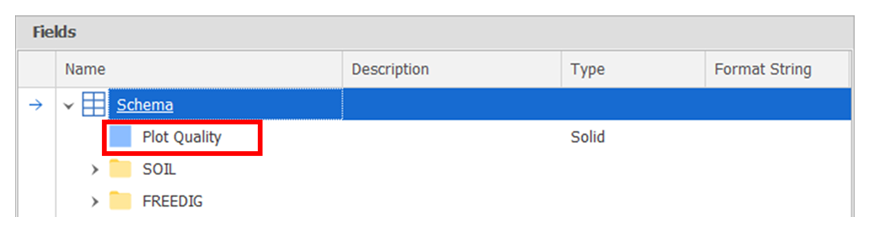
1. Add a new solid field to the source table ( ex. “plot quality”).
- Source table > Setup > field > add > new field > Solid
2. Setup table plot and Generate plotting poligon,
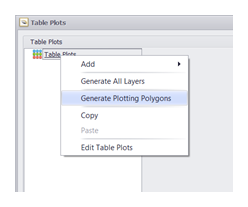
- Right click Source table > Setup > Table Plots.
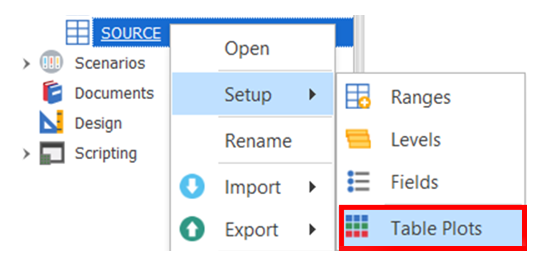
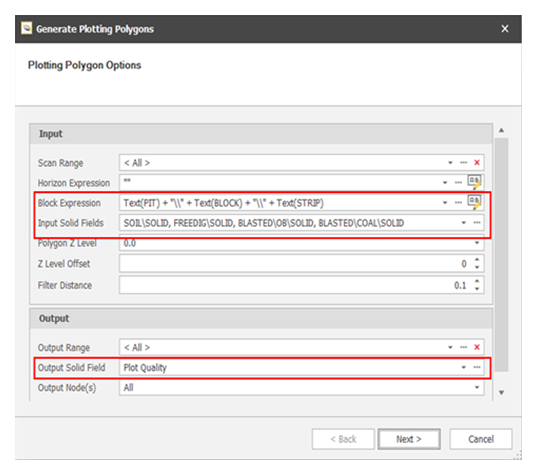
- Right click Table plot > Generate Plotting Polygon, setup data input and output.
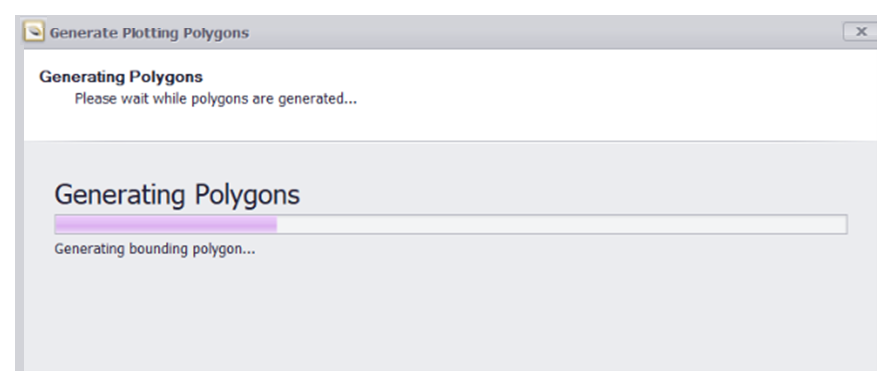
- Click Next > Next > Generating Polygon Process
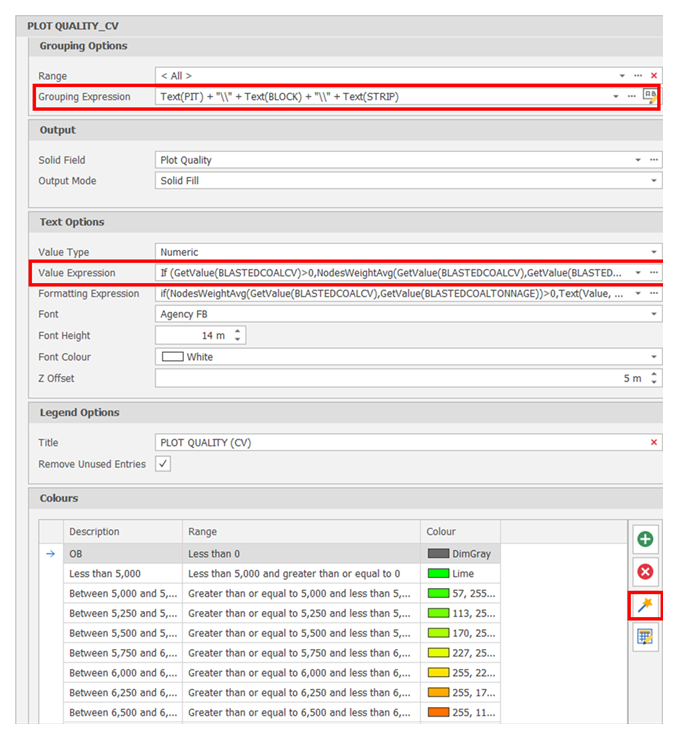
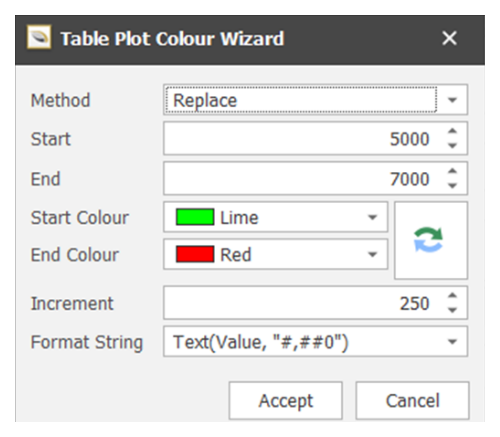
3. Create a plot table and setup some parameters.
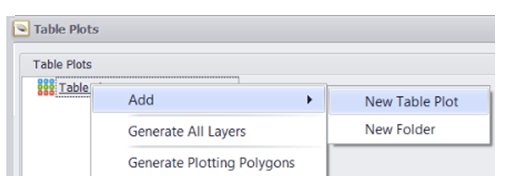
- Right click table plot > add new table plot
4. Load the table plot on the design layers to see the results of the quality distribution map.
Here are the results: