
Below are the steps to use Gantt Chart feature to analyse production targets.
For this simulation example, the annual coal production target is 3.2 million tons.
1) Open the Gantt Charts feature .
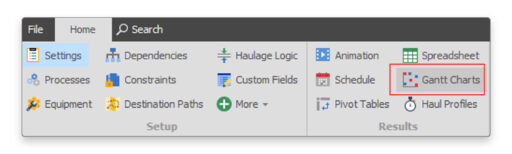
2) Right click on Gantt Charts—Select Settings—Results .
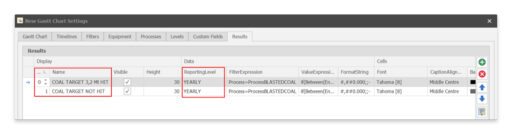
In the first line, create, for example: “coal target 3,2 Mt Hit” and in the second line, create “Coal target not Hit”, then choose reporting level yearly as seen on the screenshot below.
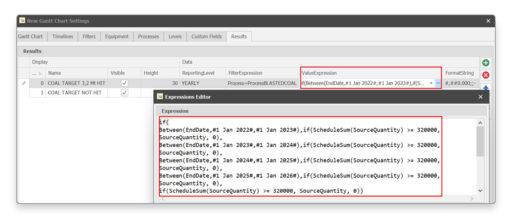
3) In the coal target 3,2 Mt Hit section, fill the field value expression with the following formula:
if(Between(EndDate,#1 Jan 2022#,#1 Jan 2023#),if(ScheduleSum(SourceQuantity) >= 320000, SourceQuantity, 0),
Between(EndDate,#1 Jan 2023#,#1 Jan 2024#),if(ScheduleSum(SourceQuantity) >= 320000, SourceQuantity, 0),
Between(EndDate,#1 Jan 2024#,#1 Jan 2025#),if(ScheduleSum(SourceQuantity) >= 320000, SourceQuantity, 0),
Between(EndDate,#1 Jan 2025#,#1 Jan 2026#),if(ScheduleSum(SourceQuantity) >= 320000, SourceQuantity, 0),
if(ScheduleSum(SourceQuantity) >= 320000, SourceQuantity, 0))
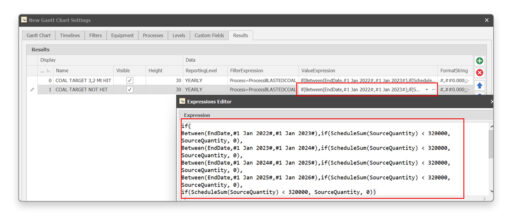
4) In the coal target not hit section, fill the field value expression with the following formula:
if(Between(EndDate,#1 Jan 2022#,#1 Jan 2023#),if(ScheduleSum(SourceQuantity) < 320000, SourceQuantity, 0),
Between(EndDate,#1 Jan 2023#,#1 Jan 2024#),if(ScheduleSum(SourceQuantity) < 320000, SourceQuantity, 0),
Between(EndDate,#1 Jan 2024#,#1 Jan 2025#),if(ScheduleSum(SourceQuantity) < 320000, SourceQuantity, 0),
Between(EndDate,#1 Jan 2025#,#1 Jan 2026#),if(ScheduleSum(SourceQuantity) < 320000, SourceQuantity, 0),
if(ScheduleSum(SourceQuantity) < 320000, SourceQuantity, 0))
The result is as follows:
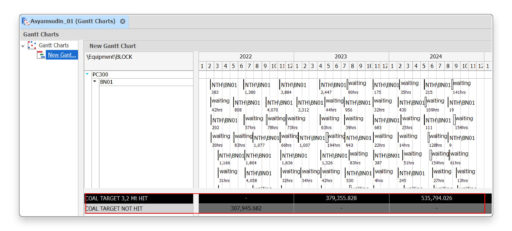
From the Gantt Chart display above, the scheduler can easily analyse and correct which simulation year that has met or fail to meet the target.